Scalable Vector Graphics - Map of Corsica
December 2015, «Visualisierung von Geodaten mit SVG» at UNIGIS
Using an early version of the Atom.io editor, static and animated SVG graphics were created as a portion of the requirements of the UNIGIS Masters of Science (MSc) program at the Department of GeoInformatics - Z_GIS, University of Salzburg, Austria. This page presents two selected SVG works. The first SVG map is a static basemap with some animation and the second one is interactive and allows to show different thematic layers.
Both work samples are accessible on the left column. Please note that SVG support varies between browser. For best results, using Opera or Chrome is recommended. Firefox's SVG support could be better and Internet Explorer is not recommended.
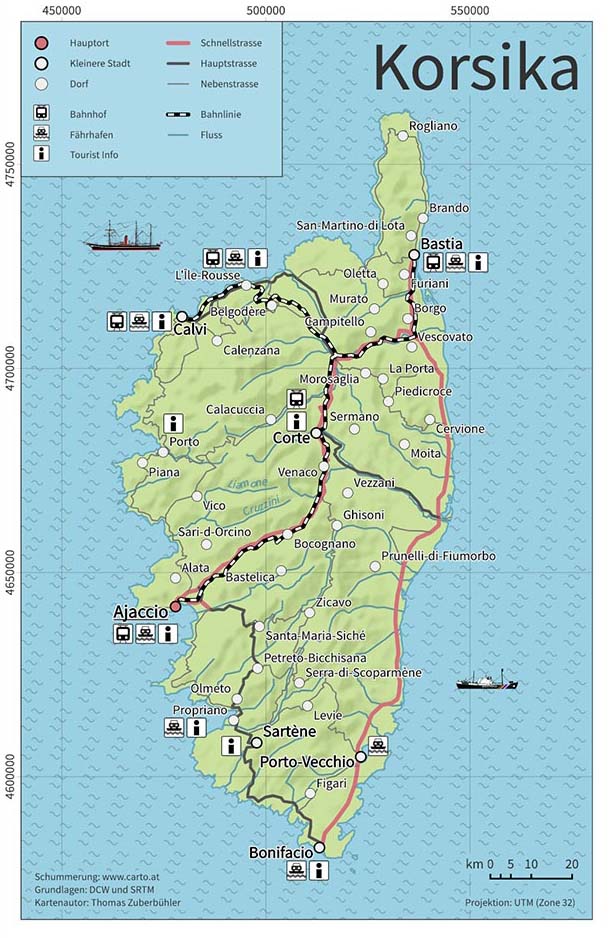
Basemap with Animations
The provided, unedited SVG files had to be cleaned-up in a first step. Then, the features were symbolized using CSS and the label were positioned using SVG transformations such as translate(). In order to automatize the halo effect for all labels, TypeScript (which compiles to JavaScript) was used and has allowed to reuse the halo effects in other works as well (the TypeScript code can be found here). And finally, CSS animations were used to animate the waves and boats.
Thematic Map
In this SVG map, thematic layers can be switched through JavaScript. Also, a data handler was implemented in order to load data from CSV and JSON data sources. No external JavaScript libraries were allowed, therefore an own implementation was needed (the JavaScript code can be found here).
Software, Technology, Data Sources and Skills
Ruby Script
Ruby is a powerful script language and was optionally used in one of the sub assignments. Due to not have access to tools such as FME at the time, a ruby script was written to transform a CSV file to a JSON file.